You may have seen this graph or similar ones promulgated by the Environmental Protection Agency purporting to show a dramatic increase in US Wildfire damage since 1983.

When viewed in the context of an entire century of data, however, it tells an entirely different story. Certainly, there is an increase from 1983 to 2006, followed by a decline from 2007 to 2014 and a slight uptick this year. But all of that activity is dwarfed by the history of wildfires in the US since the USDA Forest Service began tracking fires in 1916.
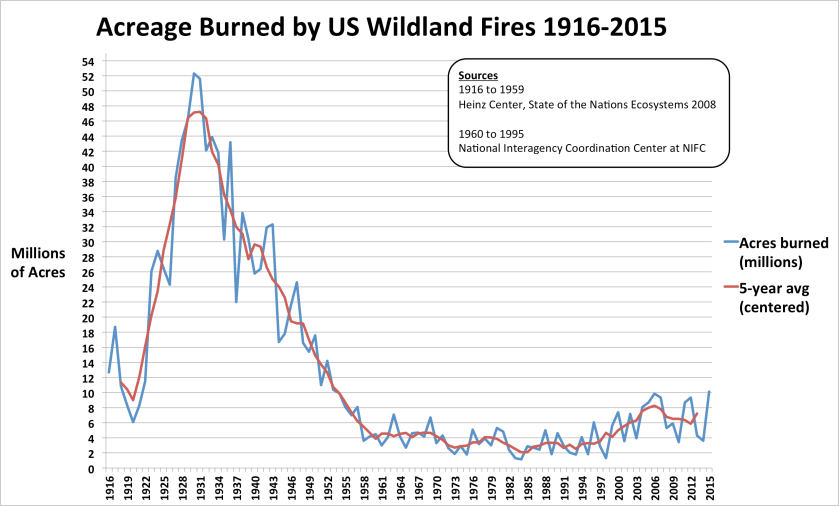
Indeed, wildfire damage in the 20th century peaked at 52.3 million acres in 1930. By 1959, the 5-year average was down to around 5 million acres, a 10-fold decrease, due in some unquantified “substantial” part (as reported by the USDA) to improved fire suppression efforts.
Between 1960 and 1999, the 5-year average has remained between 2 and 5 million acres. Over the past 15 years, the 5-year average has risen from 5 to 7.2 million acres, which may seem like a lot compared to 5 million, but it is dwarfed in comparison to 52.3 million.
