Bob Tisdale updates us with his brilliant and very clear analysis of global sea surface temperature trends.
“…the sea surface temperature record indicates El Niño and La Niña events are responsible for the warming of global sea surface temperature anomalies over the past 32 years, not manmade greenhouse gases. Scroll back up to the discussion of the East Pacific versus the Rest of the World. I’ve searched sea surface temperature records for more than 4 years, and I can find no evidence of an anthropogenic greenhouse gas signal. That is, the warming of the global oceans has been caused by Mother Nature, not anthropogenic greenhouse gases.”
Bob Tisdale - Climate Observations
MONTHLY SEA SURFACE TEMPERATURE ANOMALY MAP
The following is a Global map of Reynolds OI.v2 Sea Surface Temperature (SST) anomalies for January 2016. It was downloaded from the KNMI Climate Explorer. The contour range was set to -2.5 to +2.5 deg C and the anomalies are referenced to the WMO-preferred period of 1981-2010.
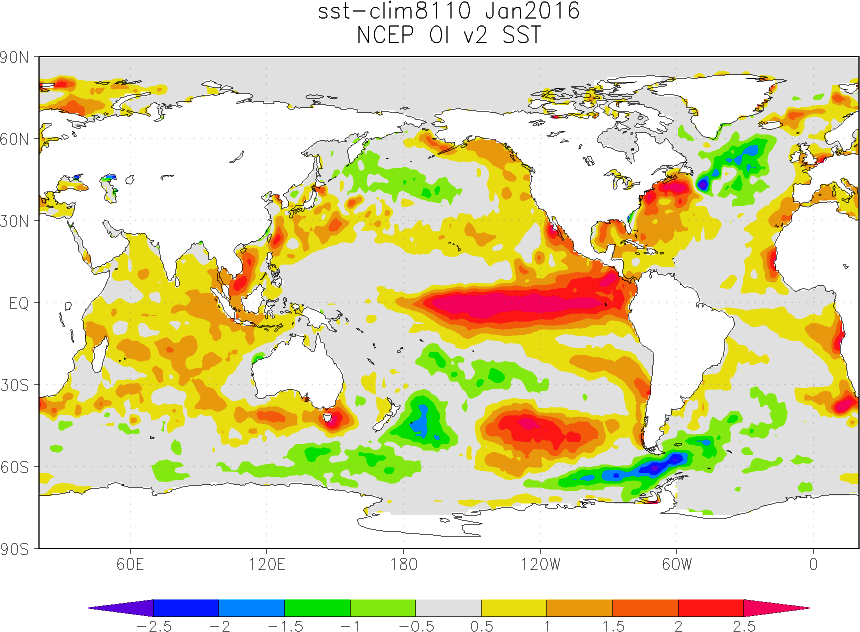
January 2016 Sea Surface Temperature (SST) Anomalies Map
(Global SST Anomaly = +0.45 deg C)
View original post 3,101 more words
