As the desperate rhetoric of politicians and politically motivated, government funded scientists continues to heat up, the scientific data is keeping a cooler head. Despite two and a half decades of wildly incorrect climate change predictions from the likes of the IPCC, NASA, the National Oceanic Atmospheric Administration (NOAA), the UK Met Office Hadley Centre, and various other alarmist champions, the climate is a stubborn thing.
Although the global temperature seems to have risen perhaps 0.7ºC over the last century, Lloyd (2015) demonstrated that the centennial natural variability of global temperature over the last 10,000 likely has a standard deviation around 1ºC. Furthermore, despite the best efforts of the usual suspects from ClimateGate and their cohorts to push the warming agenda and doctor the data sets, the numbers just refuse to cooperate.
On December 15, Patrick Michaels and Paul Knappenberger published an analysis of the temperature trends in all the major data sets (both terrestrial and satellite) versus the CMIP5 models over the last 65 years, and the picture isn’t pretty for the alarmist crowd. In Climate Models and Climate Reality: A Closer Look at a Lukewarming World (Cato Institute), Michaels and Knappenberger start with a chart produced by John Christy comparing 102 IPCC CMIP5 model runs on the troposphere against the average of all three satellite datasets and the average of all four weather balloon datasets.
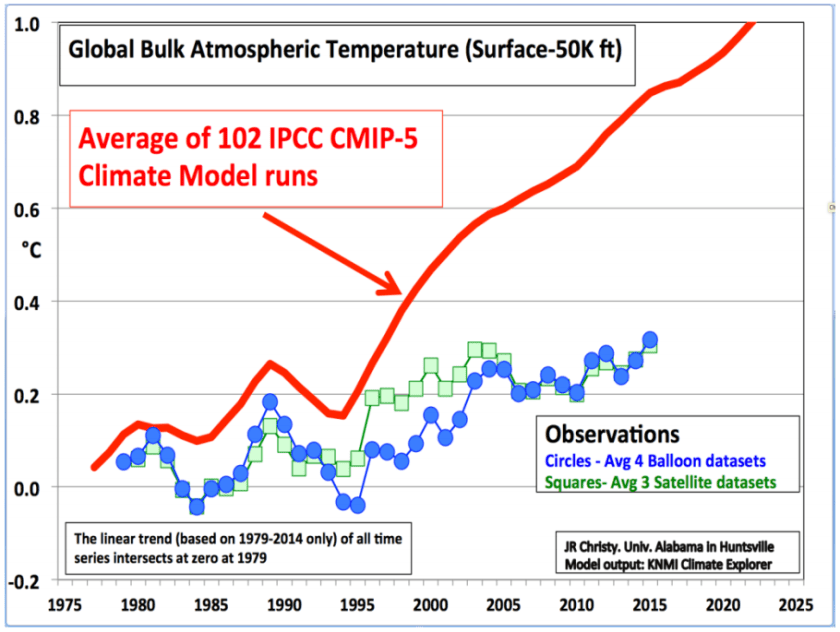
The weather balloon and satellite observations are in excellent agreement, indeed the 36-year trend is virtually identical. The 102 historical prognostications by IPCC CMIP5 models, however, wildly overestimates what is actually taking place. At first glance, one can immediately see that the multi-model mean is more than double the trend of the satellite and balloon observations. And these are the new and improved models that the IPCC relied on in its fifth failed attempt at climate change forecasting (IPCC AR5).
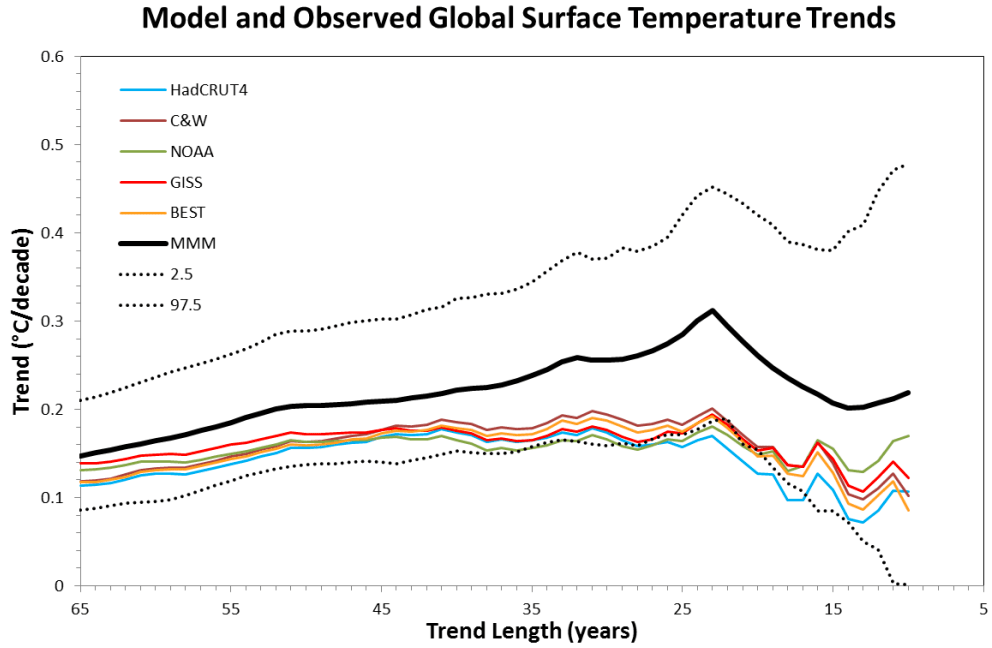
Next the authors look at all the major terrestrial datasets going back to 1950 versus 108 CMIP5 model runs. That analysis paints an equally bleak picture picture for Obama and his purveyors of climate armageddon. The five terrestrial datasets used are from the Met Office Hadley Centre and the Climatic Research Unit at the University of East Anglia (HadCRUT4), Cowtan & Way (C&W), the NOAA’s NOAAGlobalTemp (NOAA), NASA GISTEMP (GISS), and Berkeley Earth Surface Temperature (BEST). The multi-model mean is listed as MMM.
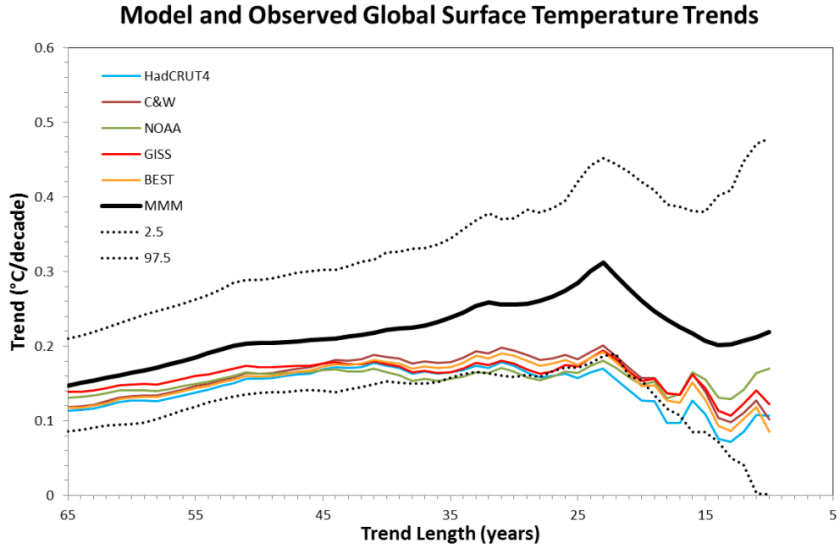
All temperature trends from 10 to 65 years in all the terrestrial data sets are below the mean of the CMIP5 models, and indeed the trends from 17 to 40 years are far below the mean in all data sets, with several of them crossing below the 2.5th percentile of all model runs. (Trends less than 17 years are generally not considered statistically significant.)
The models’ abject and continuing failure to represent reality is more striking when one looks at trends in tropospheric temperature measurements using 40 years of balloon data and 36 years satellite data. The three balloon data sets are NOAA’s Radiosonde Atmospheric Temperature Products for Accessing Climate (RATPAC), and University of Vienna’s Radiosonde Observation Correction Using Reanalyses (RAOBCORE) and Radiosonde Innovation Composite Homogenization (RICH). The three satellite data sets are Remote Sensing Systems (RSS v3.3), University of Alabama Huntsville (UAH v6.0), and NOAA’s Center for Satellite Applications and Research (STAR v3.0).

The temperature trends in these tropospheric datasets lie mostly below the MINIMUM of all model runs, not simply below the 2.5th percentile!
In my next post, I will discuss why Michaels and Knappenberger believe the models are so obviously and egregiously bad, and why the IPCC continues to rely upon such proven and consistently bad models.
