Bob Tisdale - Climate Observations
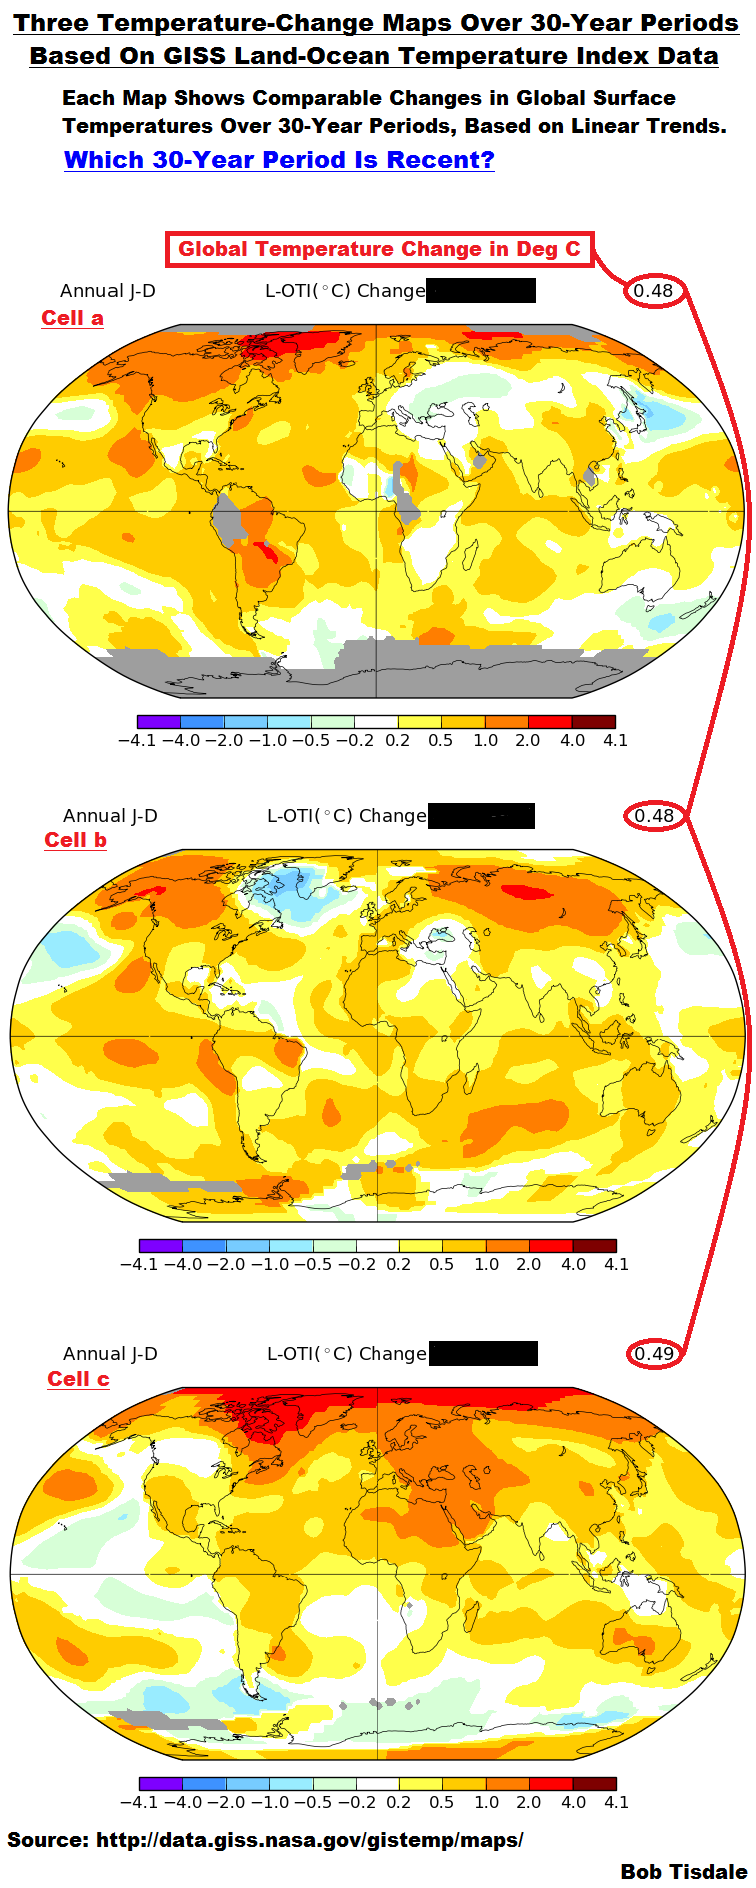
THREE MAPS ILLUSTRATING SIMILAR GLOBAL SURFACE TEMPERATURE CHANGES OVER DIFFERENT 30-YEAR PERIODS
The GISS map-making webpage allows users to create global maps of surface temperature anomalies for specific time periods or to create maps of the change in surface temperatures over user-defined time periods based on local linear trends.
My Figure 1 includes 3 maps from that webpage. They are color-coded to show where and by how much surface temperatures have changed around the globe over three different 30-year periods, based on the GISS Land-Ocean Temperature Index (LOTI) data. I’ve highlighted in red the respective global temperature changes in deg C. They’re basically the same at 0.48 deg C and 0.49 deg C. You’ll note that I’ve also blacked-out the time periods, because I’ve asked the question Which 30-Year Warming Period Is Recent?
View original post 2,153 more words
